
GEOREAL spol. s r.o.

Thermal imaging

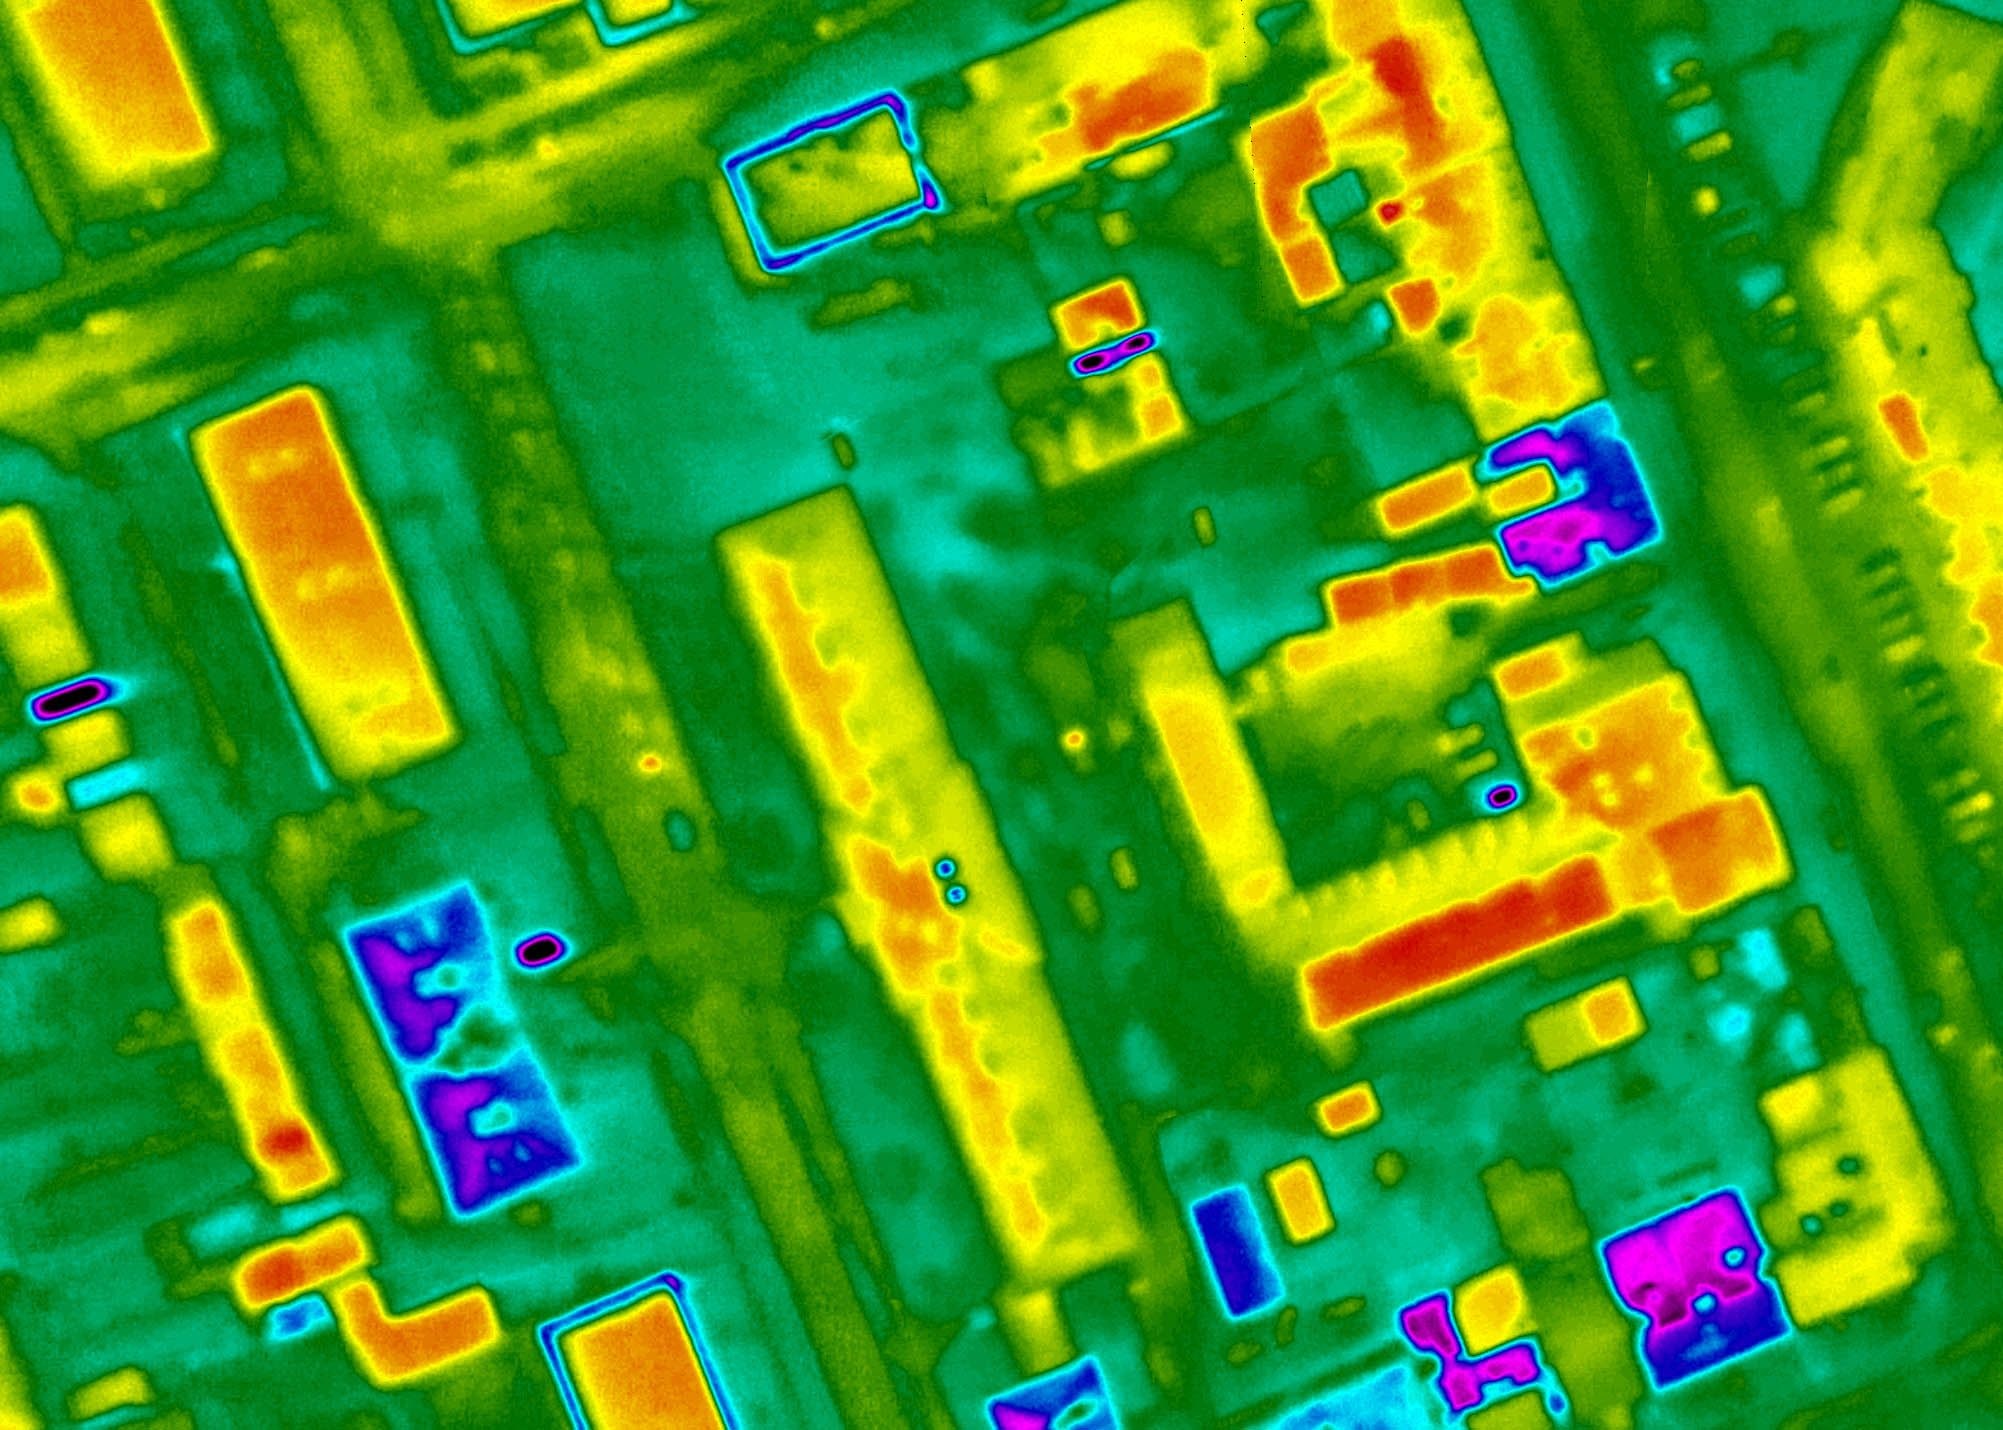
With thermal sensors on board the aircraft we record the surface temperatures of entire towns and industrial sites. The result is thermal maps with geospatial accuracy – a basis for diagnosing heat losses, checking district heating pipelines and for environmental analyses.

Thermal maps of whole areasNight-time imagingGeospatial accuracy
Thermal imaging

What it is for

The temperature of every roof and every pipe

Thermal imaging captures what the human eye cannot see: the distribution of surface temperatures across a whole area at once – from individual buildings to an entire town.

Integrated thermal sensors on board the aircraft produce thermal maps with a geospatial component – every pixel carries both a position and a temperature. Unlike ground-based thermal imaging, a single flight covers a whole settlement or industrial site, and the data can be overlaid directly on a map of buildings, networks or on an orthophoto in GIS.

Thermal diagnostics serve district heating operators for locating leaks in heating pipelines, and towns and building owners for area-wide identification of heat losses through roofs and for analyses of urban heat islands; in the environmental field it helps, for example, with monitoring outfalls into watercourses.

We fly at the times of year and times of day when the temperature contrasts are strongest – typically at night and during the heating season. Thermal data is combined with RGB imagery for easy orientation and interpretation.
The temperature of every roof and every pipe

Typical tasks

Where thermal imaging helps

  • Locating leaks in district heating networks

  • Heat losses of roofs and building envelopes

  • Analyses of urban heat islands

  • Diagnostics of civil engineering structures

  • Environmental analyses – outfalls and pollution

  • Input for municipal energy strategies

Deliverables

Everything you can receive

Thermal map of the area

A georeferenced mosaic of surface temperatures for the whole area.

GeoTIFF

Analysis of anomalies

Suspect locations marked up – leaks, losses, anomalies.

SHP / PDF

Combination with RGB

A thermal layer over the orthophoto for easy interpretation.

GeoTIFF / WMS

Assessment report

Interpretation of the results and recommendations for the next steps.

PDF

How it works

From the brief to the thermal map

  1. 01

    Brief and flight plan

    According to the purpose we choose the season, the time of day and the flight parameters.

  2. 02

    Thermal flight

    We usually fly at night, when the contrasts are strongest.

  3. 03

    Processing

    We build the georeferenced thermal mosaic and search for anomalies.

  4. 04

    Assessment

    We hand over the maps, the analyses and a report with recommendations.

Common questions

What you ask us most.

At night there is no heating of surfaces by the sun, so the measured temperatures correspond to the actual radiation of the objects – heat losses and anomalies are at their most visible. We typically fly during the heating season on cloudless nights.

Yes, a leak shows up as a pronounced warm anomaly along the route of the pipe. We mark the anomalies on the map of the network and the operator then checks them specifically – which saves both blanket excavation and long searching.

The data captures surface temperatures; absolute values are affected by the emissivity of the materials and by the atmosphere. What matters for diagnostics are the relative differences and the anomalies, and these the thermal map shows reliably.

Have a project where this fits?

Contact an expert

Ing. Luboš Hübsch

Ing. Luboš Hübsch

Team leader

Aerial photography and scanning
Thermal imaging | GEOREAL